Contents
hide
Top Sites by Revenue
This chart allows you to see how each of your websites are doing at a glance.
You can individually select which website(s) you’d like to focus on.
Or, you can use the target button to isolate single websites you’d like to spend more time analyzing.
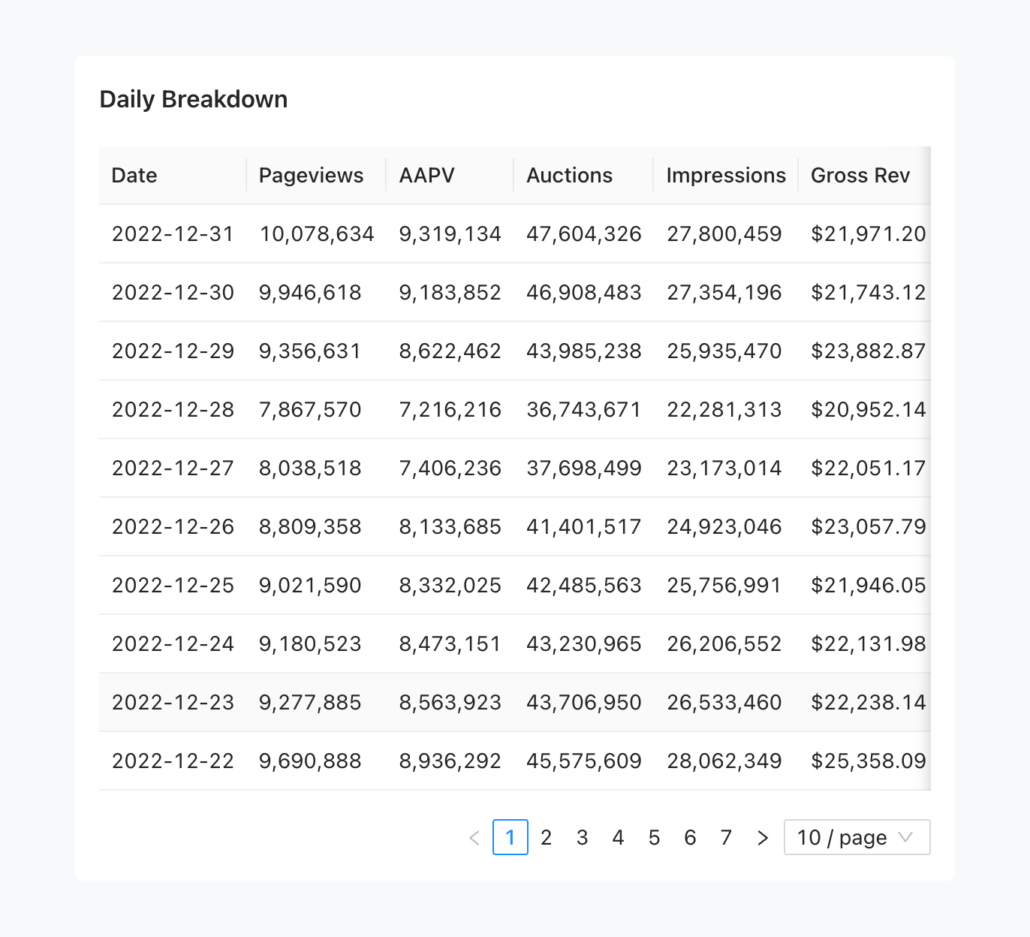
Daily Breakdown
This table offers a deeper view of your metrics on a daily basis.
You can adjust the number of rows to view more information at a glance.